Website Monitor
A private dashboard for checking website health on a daily schedule, with request budgets and timeouts for sleeping servers.
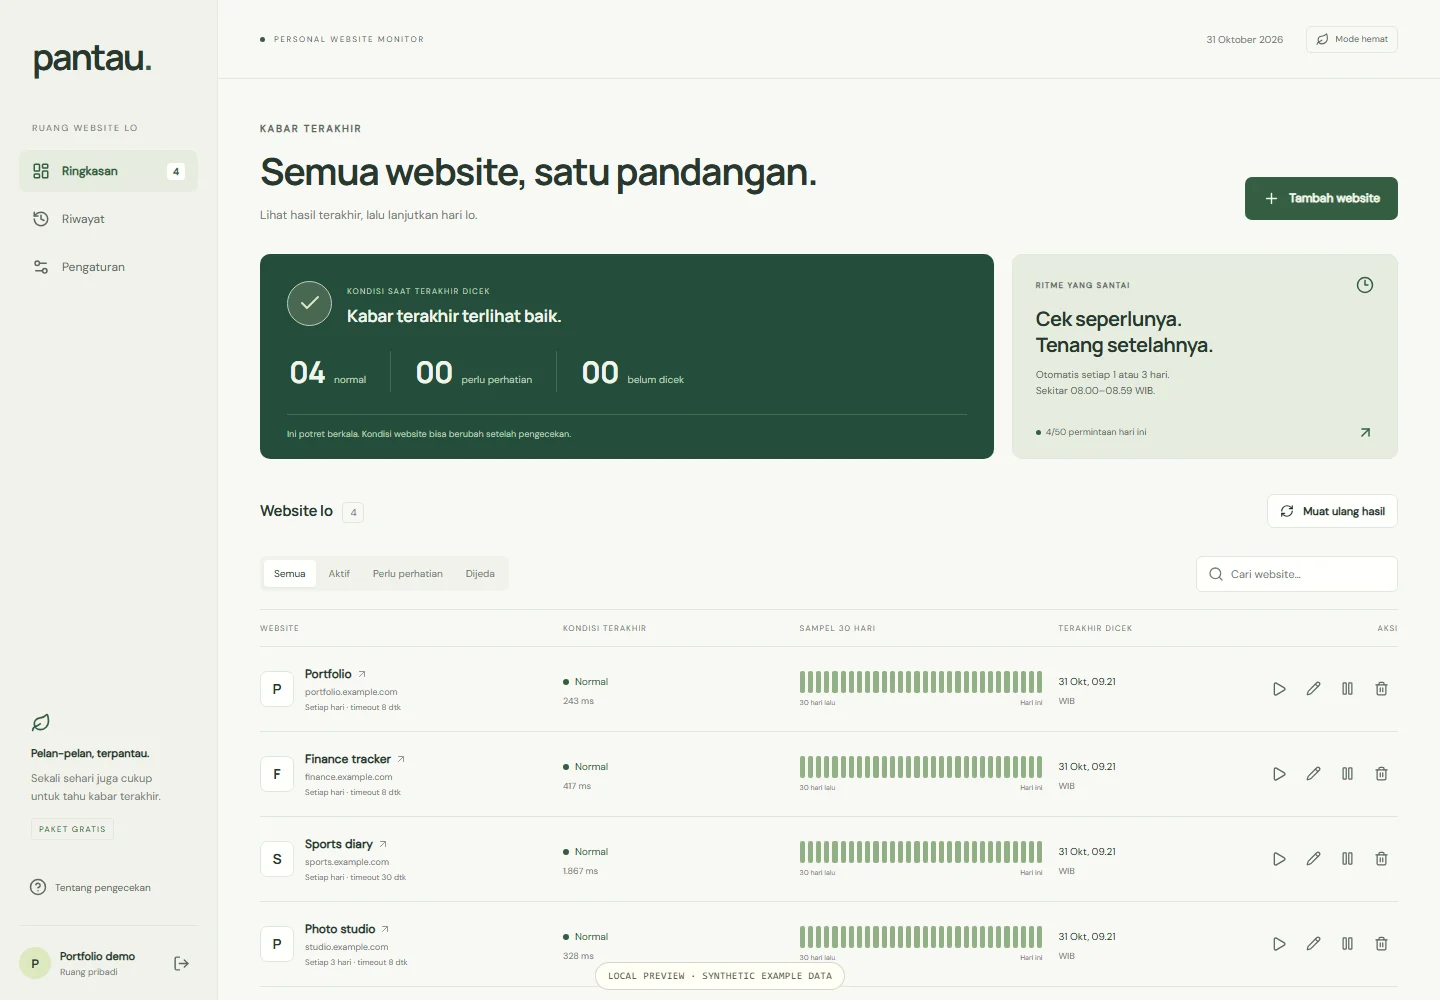
Know how your websites are doing.
Pantau is a personal monitoring dashboard for a small collection of websites, designed around daily checks and modest cloud usage.
Keep monitoring quiet and predictable.
Built a password-protected Next.js dashboard backed by Drizzle and PostgreSQL. A daily cron checks due websites at one- or three-day intervals, with request budgets, confirmed failures, and per-monitor timeouts. The dashboard presents status, response times, incidents, and recent history without automatic network polling.
- Password-only owner access with database sessions.
- Website checks every one or three days, with manual check cooldowns.
- Per-monitor 8- or 30-second timeouts for cold-start applications.
- Daily and monthly request budgets with atomic reservations.
- Status history, incidents, response times, and CSV export.
- Pause controls and optional Telegram incident notifications.
A CLOSER LOOK
02 SCREEN VIEWS
